Dashboard
Table of Contents
Dashboard
Welcome to the Dashboard page of your Elastio tenant. Here, you’ll find important information about the integrity of your data and its recoverability. With just a glance, you can get a quick overview of the results of your inspections and how they are performing. Elastio provides you an option to set up several Dashboard views based on asset tags to get even more granularity into your environment.
Our Dashboard page offers powerful tools that allow you to drill down and get more detailed insights into the metrics that matter most to you. You can easily access important metrics such as data loss, recovery and compliance exposure. The Dashboard described below is the default that includes all inventory assets, regardless of their type. If you need more granular views, refer to the Dashboard management section of this guide.
By using the Dashboard page of your Elastio tenant, you can make informed decisions about your data protection strategy. Whether you’re looking to enhance the extent of your protection, improve your recovery times, or enhance your threat detection capabilities, our Dashboard page is the perfect place to start.
The default dashboard view is AWS Overview. In addition to it, you can create your personal custom dashboards to track specific data you require.
AWS Overview
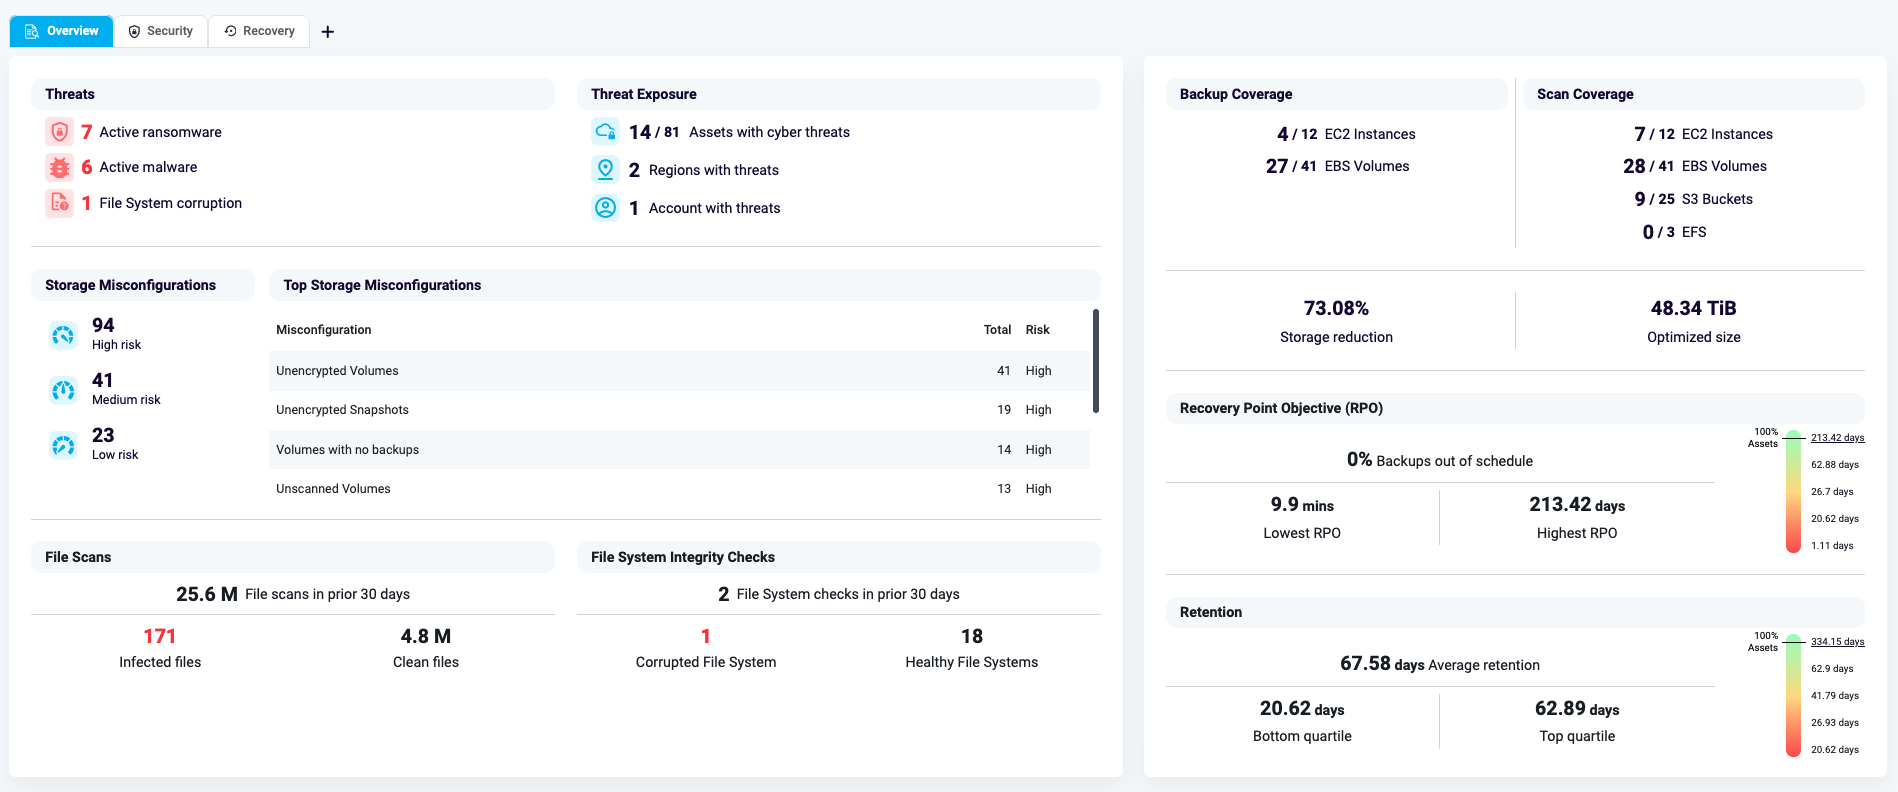
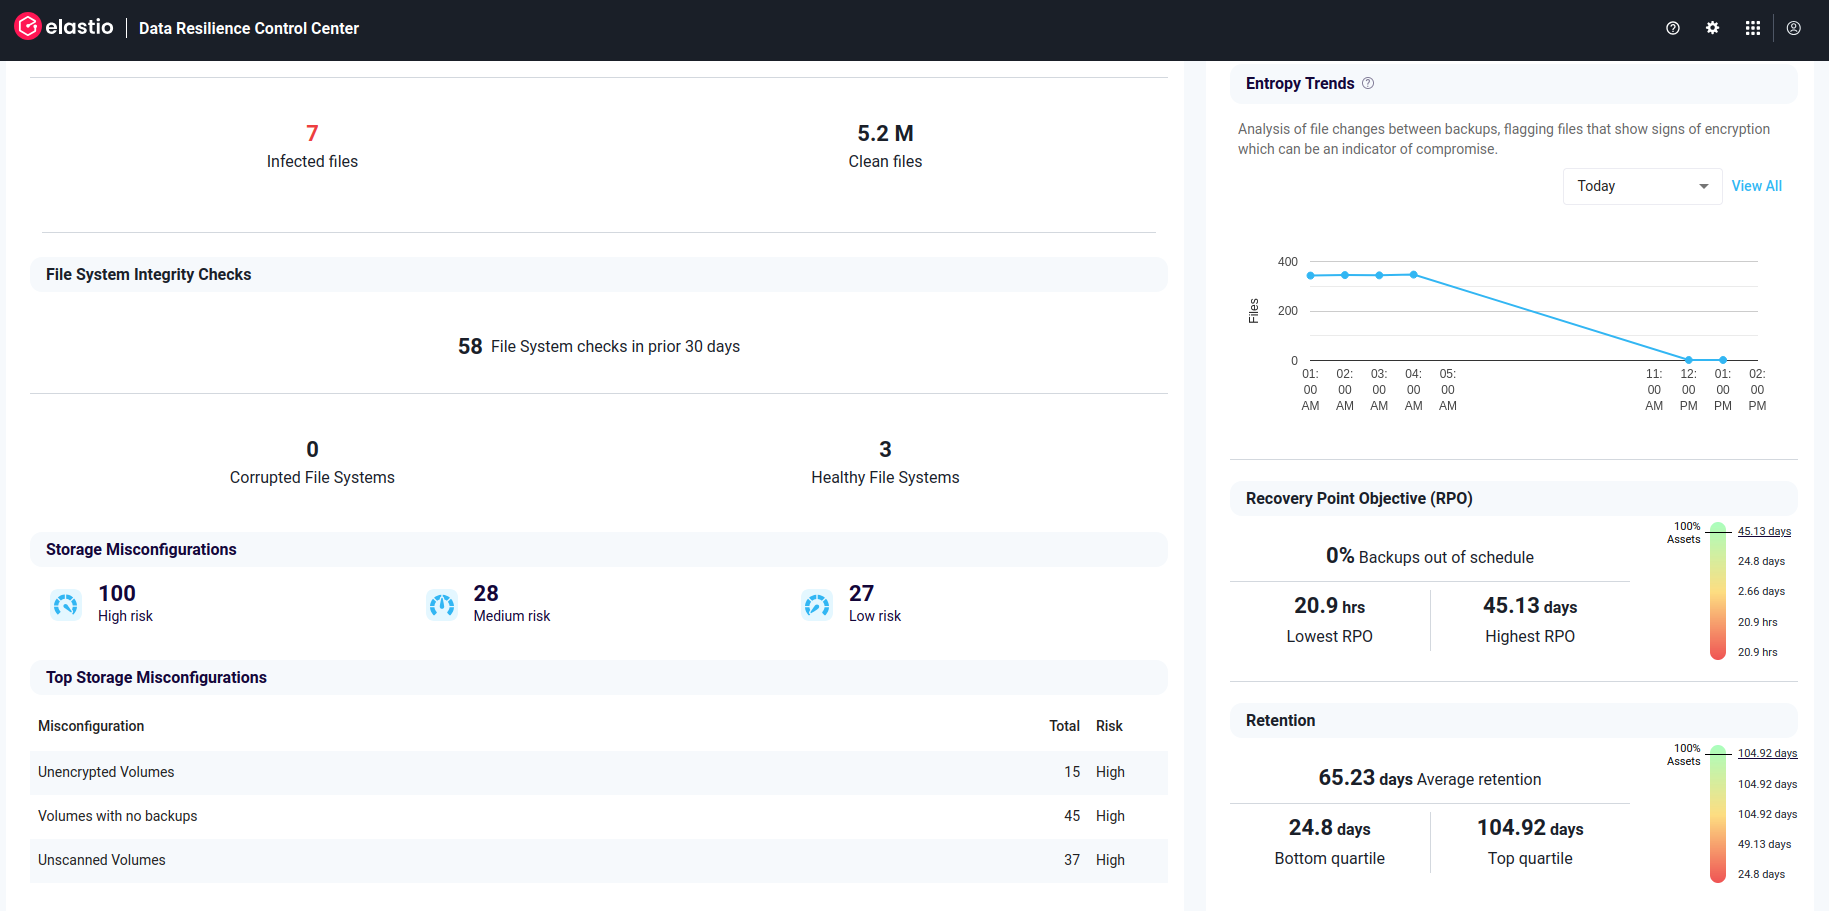
Figure 1: Overview Dashboard
AWS Overview dashboard or the Data Resilience Control Center provides an at-a-glance view of the high-level metrics such as Threat Exposure, RPO, Backup Coverage, Entropy Trends etc.
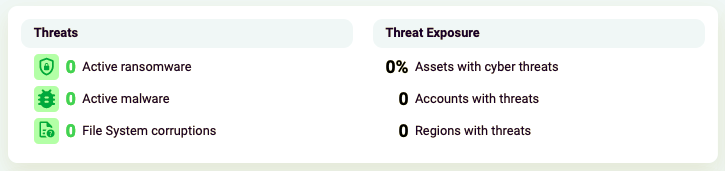
Figure 2.1: Threats
First widget on the left is focused on threats.
Threats widget consists of 2 parts: Threats and Threat Exposure. Threats section contains 3 kinds of possible threats: Active ransomware, Active malware and File System corruption.
Threat Exposure reflects the % of assets that have cyber threats, the number of accounts and regions affected.
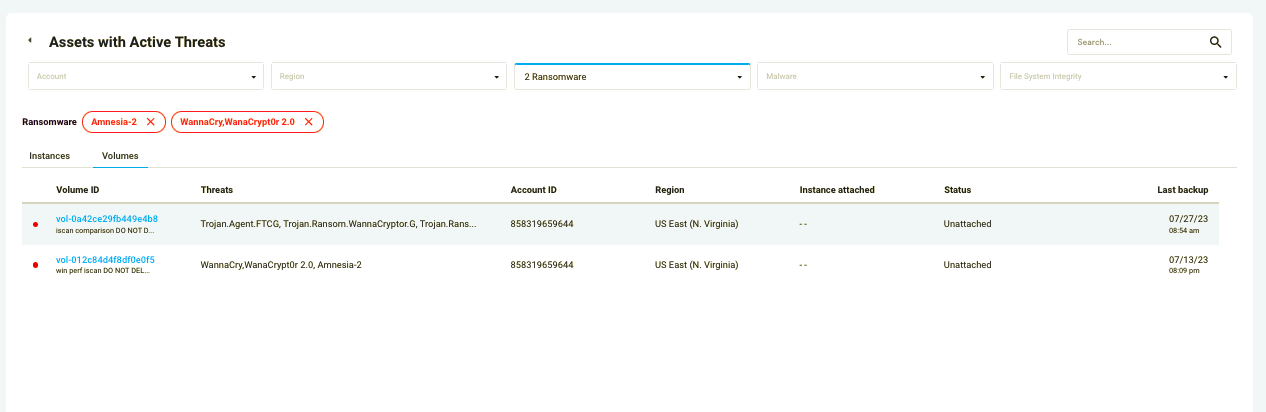
Figure 2.2: Assets with Active Threats
If you click on any of the sections, you’ll be redirected to a page with the list of assets containing that kind of active threat.
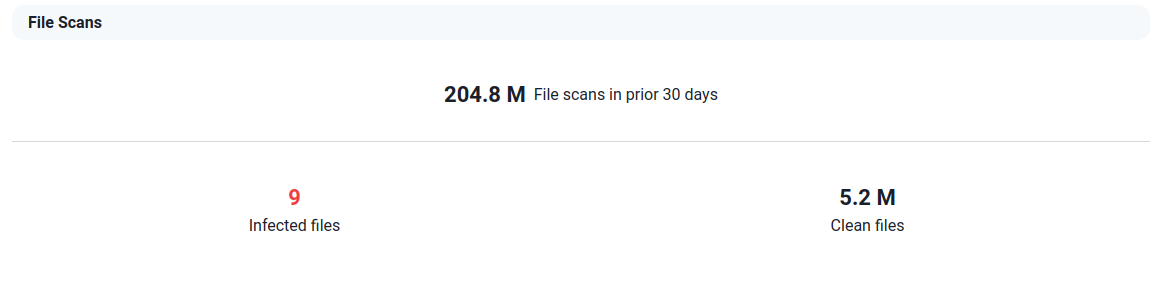
Figure 3.1: File Scans
Files scans reflects the number of files that were scanned within the scanned servers, as well as the number of infected and clean files for the previous 30 days.
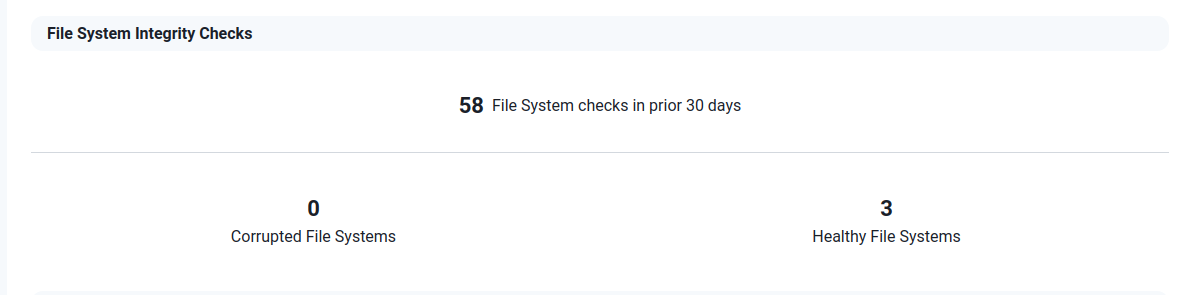
Figure 3.2: File System Integrity Checks
File System Integrity Checks section shows the number of file system checks performed alongside the number of corrupted and healthy file systems identified.
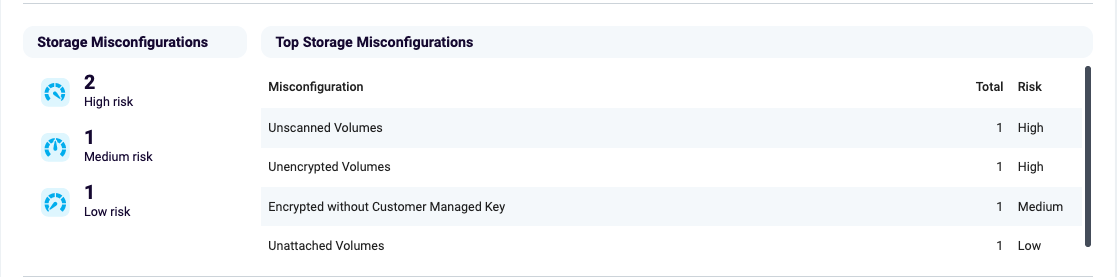
Figure 4: Storage Misconfigurations
Storage Misconfigurations widget gives you visibility into some potential issues that have been discovered within the accounts connected to Elastio. The misconfigurations are broken down into High, Medium and Low risk. Right next to the breakdown you can see a list of identified misconfigurations.
Moving to the right of the dashboard, you can see 4 more widgets: Backup and Scan Coverage, Entropy Trends, Recovery Point Objective (RPO), and Retention.
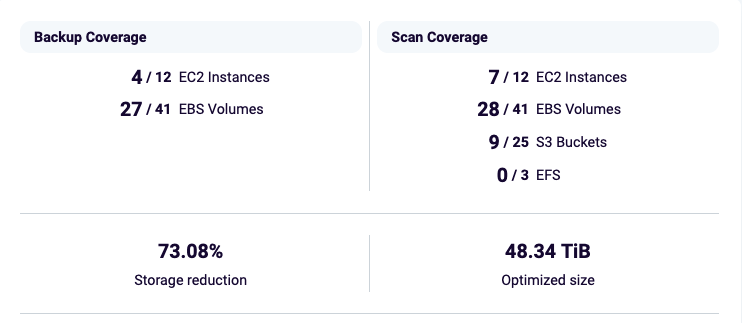
Figure 5: Backup Coverage and Scan Coverage
Backup Coverage widget provides an insight into how well the environment is protected. It displays the number of protected EC2 instances and EBS volumes compared to the total numbers, as well as storage reduction percentage and the optimized size of the backed up data.
Scan Coverage widget presents you with the number of EC2 instances, EBS volumes, S3 buckets and AWS EFS that are being scanned by Elastio compared to the total number of said resources discovered in the connected AWS accounts.
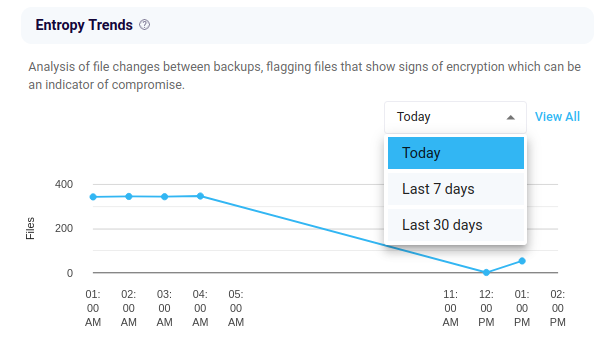
Figure 6: Entropy Trends
Entropy Trends widget offers a view for today, last7 days or last 30 days of the changes in entropy in the scanned assets.
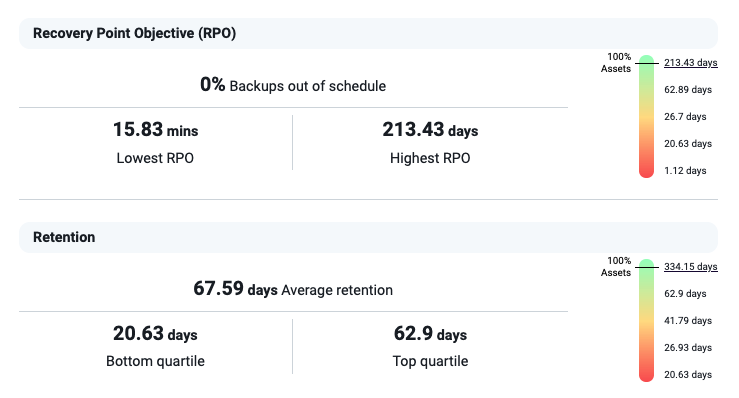
Figure 7: RPO and Retention
Recovery Point Objective is the amount of assets that were backed up within the pre-defined backup window. On this widget, you can see the % of assets that are out of schedule, as well as the highest and lowest RPOs. All aforementioned values are clickable and will redirect you to a page containing a list of assets with the selected value. The scale on the right can be clicked to view the percentage of assets with different RPO values.
Retention widget displays the average retention in days, alongside bottom and top quartile average retention values. Retention values are based on the age of the oldest retained recovery point for each asset. Clicking the scale on the right gives more insight into how assets are broken down into quartiles.
Add New Dashboard View
In order to provide a more granular view of the assets health across the organization, Elastio has introduced additional customizable Dashboard views. This way you can get analytics on certain parts of your infrastructure, such as specific accounts, regions, criticality and even organization departments.
To add a new Dashboard view, go to the Dashboard page of your tenant, and press the “+” button next to the “Recovery” tab header.
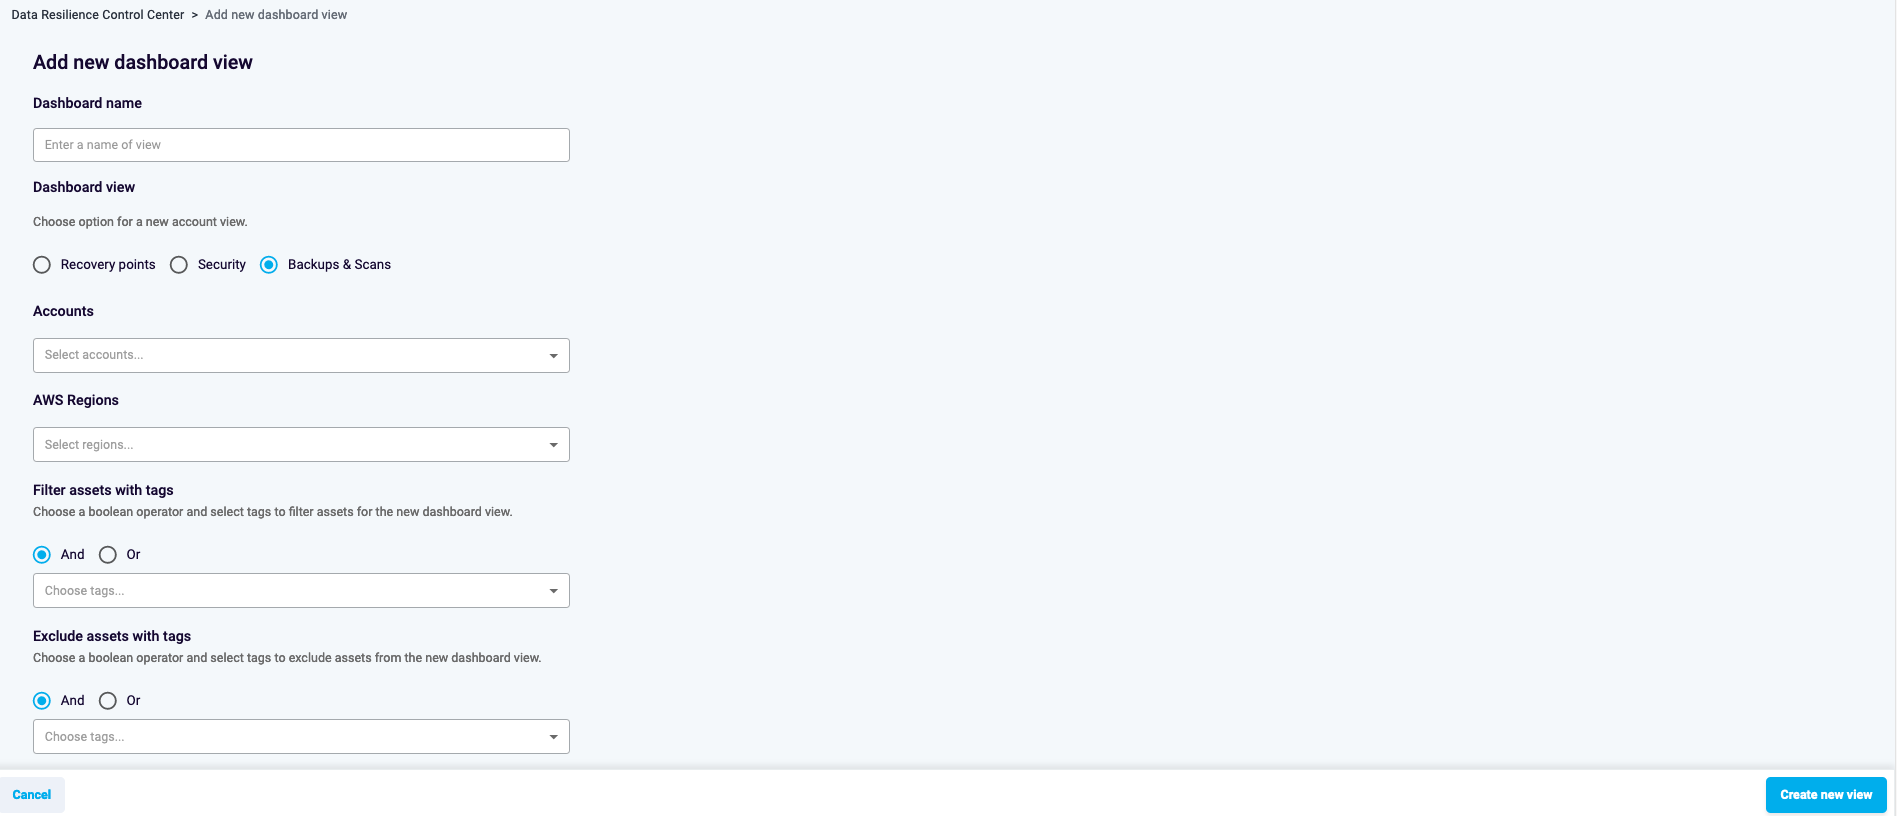
Figure 8: Add new dashboard view
On the page that opens, you’ll have several options to limit the view by. First, select the source of the data that you prefer to use - AWS or Backup Connector.
For AWS select a name for the new dashboard view. Then you have to select the view option: Recovery Points, Security or Backups & Scans, Then, select AWS account(s) and (optionally) AWS region(s). Additionally, you can filter assets by tags. Adding your tags, you can use “and” or “or” to make the filtering more granular. You can also exclude assets by tags. Exclusion works similarly to inclusion through “and” or “or” operator.
For Backup Connector select a name for the new dashboard view. Select one or several backup vendors from the drop-down list. Then select the accounts that you want to include into the dashboard view.
Note that for Backup Connector the available accounts are those of enabled backup vendors that are already linked to Elastio tenant.
Once you have selected all the settings, press the “Create new view” button. This view will appear to the right of the default “AWS Recovery” tab on the Dashboard page.
In case you need to update the custom Backup Connector view or would like to remove it, next to the name there is an options button, by clicking it you can select Edit or Remove from the drop-down list.
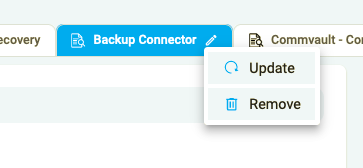
Figure 9: Backup Connector dashboard view options